Episode 1: Inventory – Initial mapping
Welcome to TETRIS, the way to Factory 4.0!
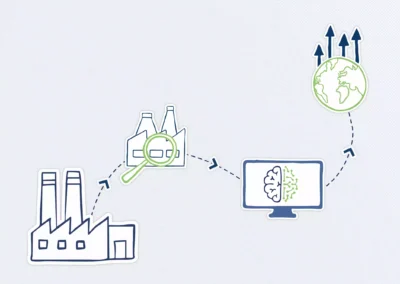
In this first season, you’ll discover our 5-step roadmap for improving your plant’s environmental performance.
Here are the 5 steps:
Step 1 – Taking stock to prepare the ground.
Step 2 – Detailed analysis, where we explore your plant in depth.
Step 3 – Adjustments to optimize your plant’s performance.
Step 4 – Guidelines and master plan, to define and structure your ideal factory.
Step 5 – Continuous improvement to sustain your environmental performance.
In this 1st episode, we’re joined by Sébastien Papouin, Energy Technical Director and co-founder of Dametis. Hello Sébastien, can you introduce yourself in a few words?
OK, great, thanks Sébastien! So, today, we’re starting with the very first step to take when you want to improve your plant’s environmental performance. This first sub-step is called initial mapping. But before we get to the heart of the matter, you’re going to tell us about the Lego theory.
Before you can improve your plant’s performance, you need to know where you’re starting from and what you’re aiming for. This theory makes it possible to define a standardized transverse frame of reference for comparing plants with each other, block by block. Each block will contain its own business rules and data. I’ll leave it to Sébastien to define the initial cartography.
The idea is for this mapping to become a standard for you, i.e. when an auditor, for example an external auditor, comes to audit your plant, whether it’s an energy audit or something else, he or she should do so on the basis of this mapping that you have standardized.
Sébastien, what are the prerequisites for mapping and how long does it take?
Do all manufacturers carry out initial mapping?
Can you tell us who’s doing the initial mapping? How are things coordinated between the different teams?
What are the difficulties of mapping? What are the pitfalls to avoid?
This mapping is the starting point for any plant analysis, whether it’s an energy audit or some other kind of audit, and will be used to contextualize the data.
In a nutshell
Initial mapping gives you a synthetic, global view of all your plant’s processes and flows.
It allows you to:
1. Visualize all plant components, from raw materials to finished products, processes and utilities.
2. Finally, it lays the foundations for defining THE standard for your plant.
In short, initial mapping is the starting point for your industrial environmental transition.


