Data processing VS Artificial Intelligence for energy efficiency

Manual data processing and artificial intelligence are often presented as opposites. At Dametis, our experience shows that human experience is still necessary to achieve better results withArtificial Intelligence, particularly in the field of energy efficiency.
Jérémy Barrais, Product Manager at Dametis, talks to us about the advantages of Dametis’ data processing method over conventional big or smart data.

The difference between Big Data, Smart Data and the data models used by Dametis
Big Data: AI is supplied with a maximum amount of data
Due to the heterogeneous nature of Big Data, correlations can be found at random. The large number of parameters involved affects the accuracy of the various correlations. Worse still, some may be completely meaningless.
Correlations of this kind have already been made. For example, an AI has linked the number of ice-cream sales and drownings, even though the two have no causal link. They just have the same cause, the increase in beach visits.
Another example: it has been observed that the number of toilet flushes in one southern US state was proportional to the number of divorces in the opposite state. But there is no link between these two phenomena.
Smart Data: Data is selected by theme, to limit it to a functional context.
With Smart Data, data is grouped by theme, limiting the AI to using data from relevant functional perimeters. In this way, we ensure that reconciliations are made with data that may have a causal relationship between them. The challenge is not to delimit the perimeter too much, so as not to exclude upstream factors that may ultimately have an influence.
Business expertise remains fundamental at this stage. Our Dametis specialists carry out on-site measurement plans, a fundamental element of smart data, enabling the selection of the most significant and powerful data.
Dametis model: data are contextualized before analysis by AI.
Thanks to their in-depth expertise, Dametis specialists know which areas of an industry can be correlated, and which plant data theartificial intelligence needs to examine in order to propose optimizations, and detect anomalies and deviations.
The block diagram, a support for contextualizing data
Dametis will then give a context to the various data to enrich the AI’s analysis.
To do this, Dametis will first define the physical relationships between the data, thus building a “schema”.
In addition to this mesh, the data will be fed into ” blocks ” representing the different installations of a plant (itself being a block in its own right, made up of “child” blocks, which is the basis of our “Lego theory”).
These blocks are parameterized by our experts to integrate all the ” business” logic. This mesh and these blocks represent our “block diagram” concept.
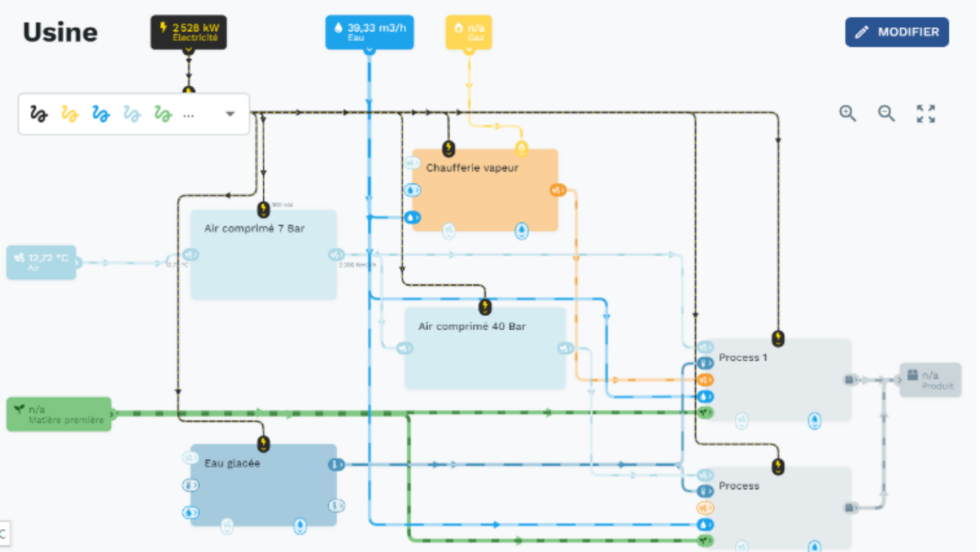
The block diagram, a concept for refining predictions
Once constructed, the block diagram makes it easy to map a plant, a utility, a process or a piece of equipment.
For example, the temperatures of a fluid at the various stages of its circulation loop (central outlet, exchanger 1, exchanger 2 inlet, central return, etc.) will no longer be evaluated independently, but in relation to each other. For a compressed air system, compressor M/A, power consumption, flow rate and central outlet pressure are all linked together to provide a “link” between the data.
By associating them with a block diagram representing the installation, additional contextual information is added to the data, which is then fed with knowledge, known as metadata.
The operating conditions of each block will also be entered to provide even more information, such as operating instructions.
This contextualization in the form of block diagrams enriches the data collected, enabling us to refine our modeling and predictions.
Imagine having specialists working 24/7 to optimize your industrial sites. That’s what MyDametis offers you, the only platform designed 100% by experts in environmental performance.

A model with multiple benefits
Jérémy Barrais reminds us that, although Dametis’ initial actions were focused on the energy aspect, today the areas examined go much further, including material losses and the optimization of in-place washing times (CIP).
Once the model has been parameterized by our experts, the AI will use all these elements to model your entire installation, from the smallest element to the largest whole.
There are many benefits to be gained from this.
Real time
You can consult your own data and those modeled in real time. This allows you to see which data are faulty or drifting. MyDametis’ optimized graphical analysis module also lets you view data over different aggregation periods, so you always have the macro view best suited to the phenomenon observed.
It’s easy to switch between “second” views for a temporal analysis of operation, “hourly” views for a consumption profile, and “daily” or “monthly” views to track consumption and reconcile it with your bills.
Drift analysis
This real-time control gives you complete control over your installations. Nothing is left to chance, since the slightest drift is visible on your platform.
Automatic notifications
You receive automatic notifications as soon as a data item or analysis is suspected. For example, in areas where the volume of material losses is suddenly high. You also receive alerts when there is a technical failure.